What does an audiogram show?
An audiogram records the quietest tones you can detect at different pitches. Each plotted point is a hearing threshold. Start with the pitch, find the symbol for the ear, then read its hearing level on the side of the graph. [1]
Keep your own test results nearby as you read. This guide helps you navigate the page and prepare questions. Your audiologist can explain how your results fit with your symptoms, history, and other tests.
1. Read the two axes
Across the chart: pitch in hertz (Hz)
Low pitches sit on the left; high pitches sit on the right. Common test frequencies include 250, 500, 1,000, 2,000, 4,000, and 8,000 Hz. Your test may include additional frequencies. [2]
Down the chart: decibels hearing level (dB HL)
The numbers increase as you move down. A point farther down means the tone needed a higher level before it was detected. The scale uses a calibrated hearing reference: 0 dB HL does not mean no sound. It is not a percentage of hearing. [3]
2. Check which ear and test each symbol represents
Use the legend on your own report. These are common air-conduction symbols, used when tones are delivered through earphones. Color helps, but the shape matters too. [3]
| Symbol | Ear | Test condition |
|---|---|---|
| O, often red | Right | Without masking |
| X, often blue | Left | Without masking |
| △ | Right | With masking |
| □ | Left | With masking |
Masking uses sound in the other ear to help isolate the response from the ear being tested. Brackets or angle-shaped marks can indicate bone-conduction testing. A downward arrow attached to a symbol generally means no response at the level tested, rather than a measured threshold. Ask your audiologist to explain unfamiliar marks. [3]
3. Follow one point on an example audiogram
This is a fictional teaching example. It shows selected air-conduction thresholds, not a real person's hearing test or a diagnosis.
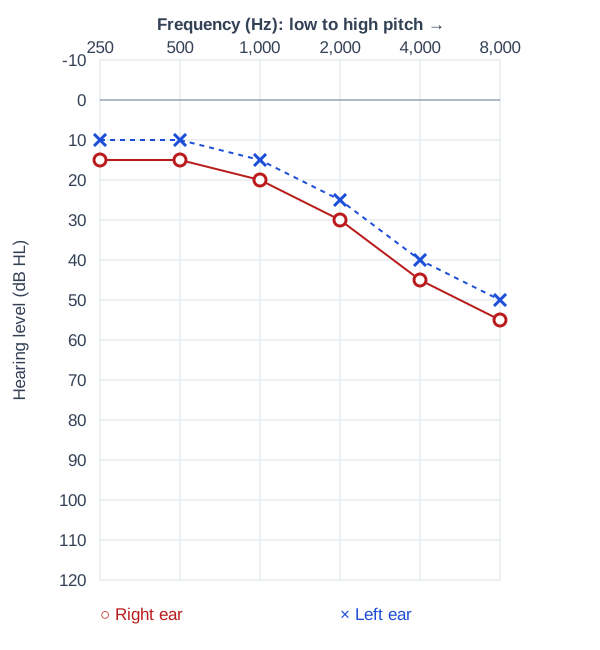
- Find 4,000 Hz along the horizontal axis.
- Find the right-ear O above that frequency.
- Read across to the vertical scale: the threshold is 45 dB HL.
- Compare the same ear at 500 Hz: its threshold is 15 dB HL. In this example, the higher-pitched tone needed a higher level.
| Pitch (Hz) | Right ear (dB HL) | Left ear (dB HL) |
|---|---|---|
| 250 | 15 | 10 |
| 500 | 15 | 10 |
| 1,000 | 20 | 15 |
| 2,000 | 30 | 25 |
| 4,000 | 45 | 40 |
| 8,000 | 55 | 50 |
Use the same sequence on your report: pitch → ear → hearing level. Leave conclusions about the cause and treatment to the clinician reviewing the complete evaluation.
4. Understand hearing loss ranges
Degree describes the amount of hearing loss. The table below uses the classification published by the Communication Health Support Association, linked from ASHA's patient information. Other systems use different cutoffs, especially around the normal range. [4]
| Classification | Range (dB HL) |
|---|---|
| Normal | −10 to 15 |
| Slight | 16 to 25 |
| Mild | 26 to 40 |
| Moderate | 41 to 55 |
| Moderately severe | 56 to 70 |
| Severe | 71 to 90 |
| Profound | 91 or greater |
A single ear can have thresholds in several ranges. Ask which classification your clinician uses and whether a summary refers to individual frequencies or an average. These labels do not translate directly into a percentage of hearing or a complete account of your communication needs.
5. Look beyond the tone chart
Air conduction and bone conduction
Earphones test sound traveling through the outer, middle, and inner ear. Bone-conduction testing uses a vibrating device to bypass the outer and middle ear. Comparing these results helps an audiologist distinguish conductive, sensorineural, and mixed hearing loss. The air-conduction line alone does not establish the type. [5]
Speech testing
Hearing a beep and understanding a sentence are different tasks. Speech testing adds information about hearing or recognizing spoken words. Testing in background noise can help address situations that a quiet tone test does not capture. Ask which speech tests were included and what the results mean for your everyday conversations. [5]
Changes over time
Bring earlier reports to your appointment. Ask the clinician to compare the results and explain whether any change needs follow-up. A graph's shape should prompt questions, not a self-diagnosis.
Five questions worth asking
- What is the degree and type of hearing loss in each ear?
- Which pitches are hardest for me to hear?
- How did I do on speech testing, and would testing in noise help?
- Do my symptoms or the difference between my ears need further evaluation?
- What are my options, and when should my hearing be checked again?
Add one real-life example, such as missing conversation at dinner or struggling on the phone. It gives your clinician a specific situation to discuss.
Common questions about hearing test results
Does 40 dB HL mean 40% hearing loss?
No. dB HL is a hearing-level measurement. A point at 40 dB HL describes a threshold at one frequency; it is not a percentage of hearing lost.
What is the “speech banana” on an audiogram?
It is an illustrative area showing where many speech sounds fall in pitch and level. It is a teaching aid, not your personal speech-understanding score. Speech varies by speaker, language, and situation. [1]
Does this chart tell me whether I need hearing aids?
The chart is one part of that discussion. Bring your listening difficulties and goals to the appointment, and ask how the complete evaluation informs your options. Do not choose a device from this example chart.
Sources and editorial information
References checked October 1, 2026. AI assistance was used in preparing this guide. See our editorial standards for how Hearing Is approaches sources and review.
- Communication Health Support Association: Audiograms and Hearing Loss Configuration.
- ASHA: Guidelines for Manual Pure-Tone Threshold Audiometry.
- ASHA: Audiometric Symbols.
- Communication Health Support Association: Degree of Hearing Loss, citing Clark's classification.
- Communication Health Support Association: Types of Hearing Tests.
- NIDCD: Sudden Deafness.
Hearing Is publishes educational information, not individual diagnosis or treatment advice. Read our editorial standards and medical disclaimer.